The Mandelbrot set was discovered by Benoît Mandelbrot. Since Mandelbrot discovered these fractals first, they are considered the most famous fractal. When he studied this fractal, there were not any computers to generate the fractal or to do the calculations for him, but he was able to use mathematics to predict its complexity. Later, he was able to use a computer to see his fractal come to life. Mandelbrot discovered the Mandelbrot set by studying theories from Gaston Julia which is part of the reason why the Mandelbrot set and the Julia set are closely related.
How is the mandelbrot set generated?
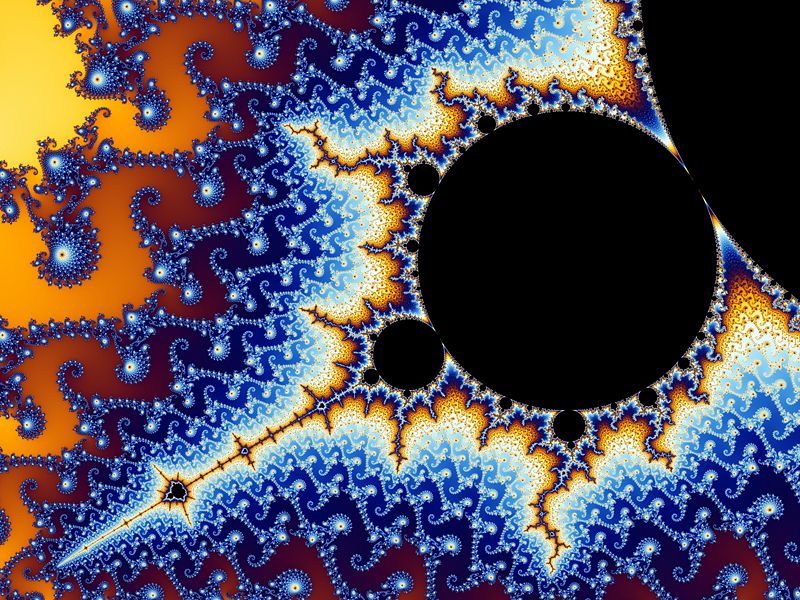
In 1980, an IBM supercomputer generated the Mandelbrot set for the first time. The Mandelbrot set can be created in a plane of complex numbers where every point represents one number. For every point in the plane, run the point, represented in the equation as c, through the equation:
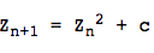
where n is the number of iterations. The result of the function would be the new z for the next iteration. The point is run through the function through many iterations. If the number generated increases beyond the distance of 2 from the center, (increases beyond 2 or -2) then the point diverges and is not a part of the set. However, if the point remains inside the distance of 2 from the orgin during all iterations (would go through infinite iterations and still be in the bounded amount) , then the point is a part of the set. When fractals are generated, each point is not put through infinite iterations because it would take too long, but they do go through, thousands, millions, and even billions iterations.
Also, the Mandelbrot set can be created using the function:
f(z) = z^2 + c
Where z is the iteration starting with z = 0 for the first iteration. For the first iteration, c equals any complex number but as the function is iterated, c becomes the result of the previous iteration.
With both equations, when a new point is run though, the values revert back to their original amount.
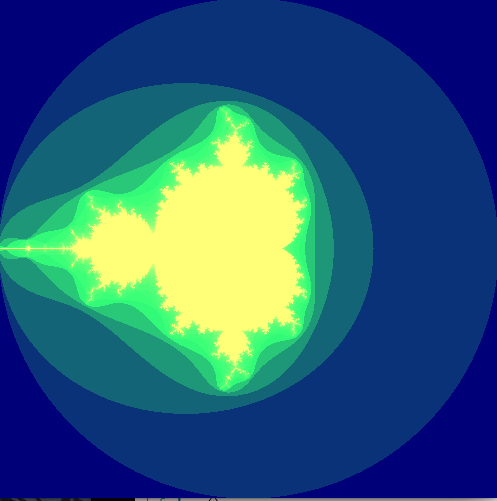
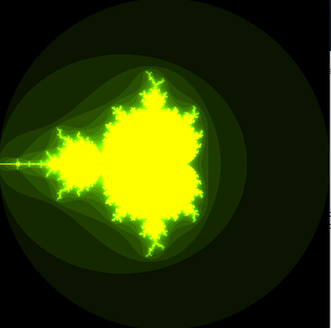
In the photo above, the origin is in the middle of the picture. Every number that will always remain under the distance 2 or -2 from the origin when it goes through the equation for many iterations is colored very light yellow. For this picture, the very light yellow color represents the numbers that are included in the set. All of the dark blue represents the numbers that do not fit this boundary or are not a part of the set. The light blue coloring around the edges represents the iteration when a number maxes out of the boundary. The closer the color is to the light green, the closer the number was to being a part of the set. However, it still escapes the boundary eventually, so it is not a part of the set.
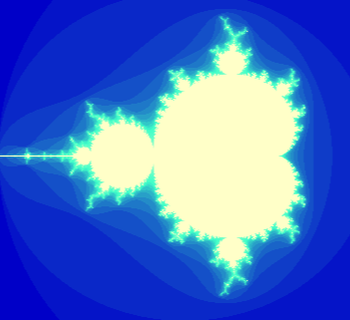
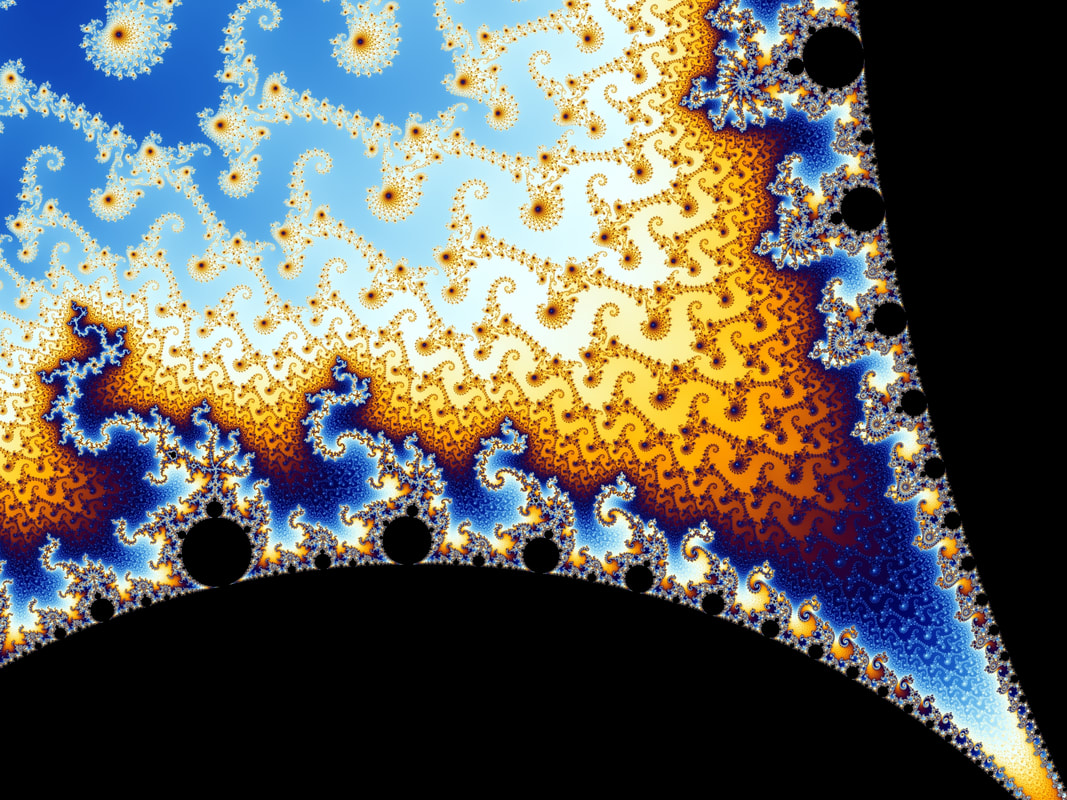
To find the seed (the self-similar shape) of the Mandelbrot set, zoom in on parts of the edge and the shape will reoccur. And to find the Julia Set within the Mandelbrot set, zoom around the boundary, or edge, as well.
To find the seed (the self-similar shape) of the Mandelbrot set, zoom in on parts of the edge and the shape will reoccur. And to find the Julia Set within the Mandelbrot set, zoom around the boundary, or edge, as well.
|
|
Understanding the mandelbrot set
- Points outside the set grow exponentially (very fast) toward infinity when they are put through the equation many times in the function.
- Points close to being a part of the set but that are not a part of it move toward infinity slower, but they still get there.
- Points inside the Mandelbrot set never escape the boundary limit of 2 to get to infinity.
The Mandelbrot set is closely related to the Julia Set. Learn more here:
